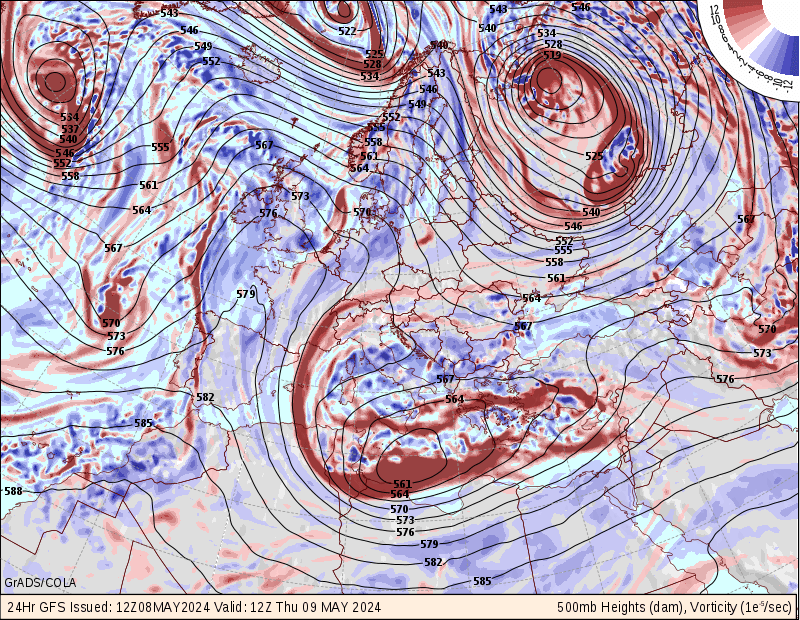
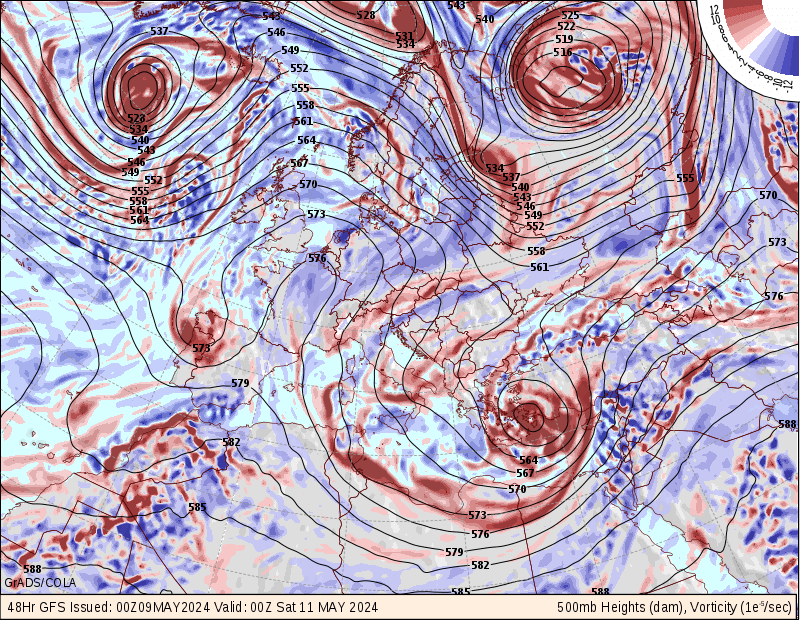
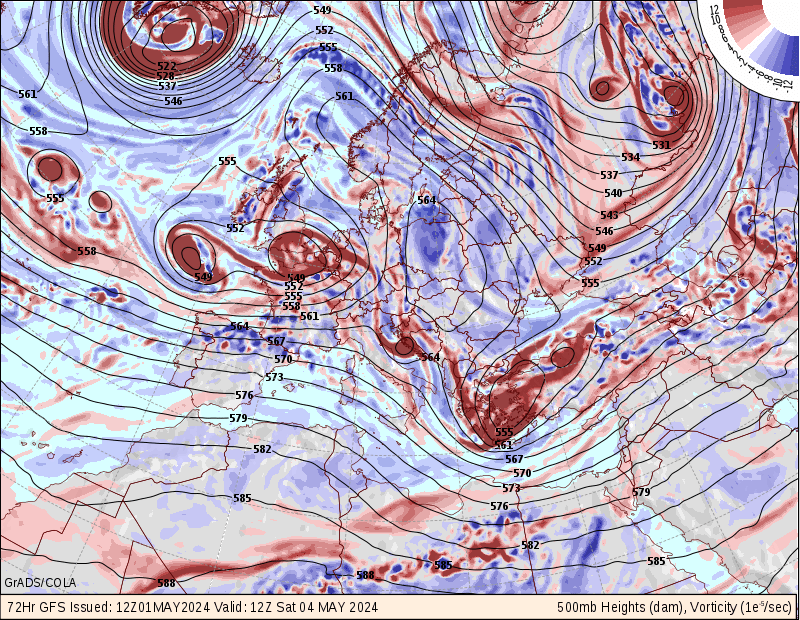
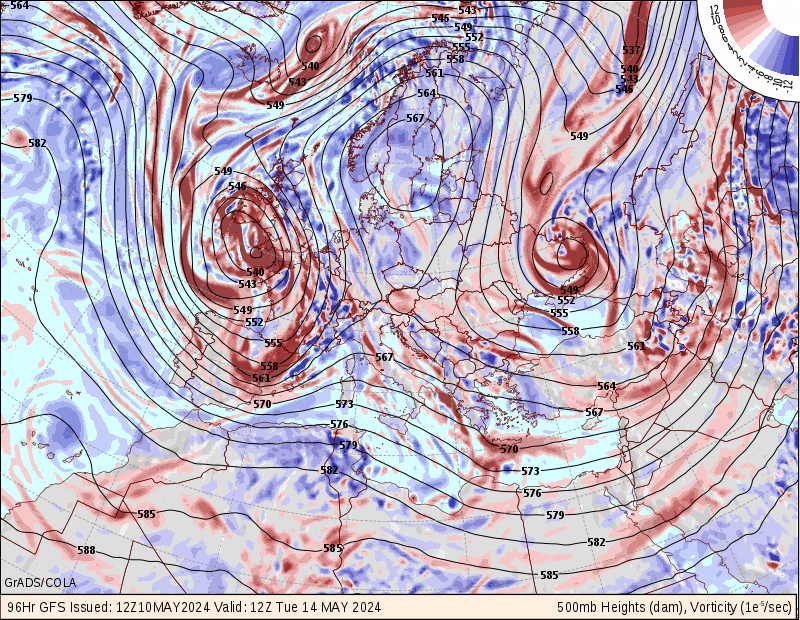
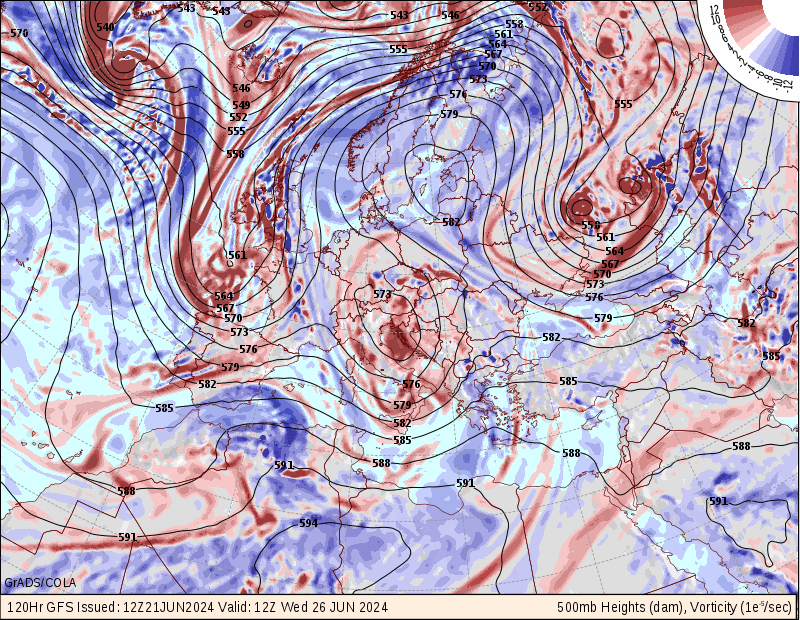
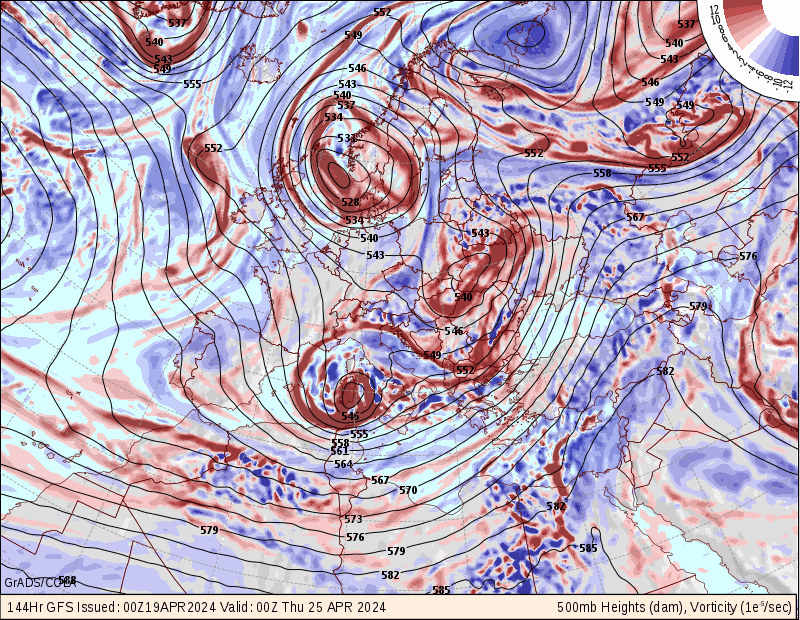
500mb Geopotential Heights, Height Change and Vorticity
- Black contours indicate the geopotential height of the 500 millibar
surface, in tens of meters.
- Low geopotential height (compared to other locations at the same
latitude) indicates the presence of a storm or trough at mid-troposphere
levels.
- Relatively high geopotential height indicates a ridge, and quiescent
weather.
- In the forecast panels, the colored contours indicate the change in
geopotential height during the 12 hours leading up to the valid time.
- Decreasing geopotential height usually indicates an approaching
or intensifying storm.
- Increasing heights usually indicate clearing weather for the period.
- The color shading indicates vorticity at 500 millibars: Red for positive
vorticity, blue for negative.
- Positive vorticity indicates counterclockwise rotation of the
winds, and/or lateral shear of the wind with stronger flow to the
right of the direction of flow.
- Negative vorticity indicates clockwise rotation of the winds,
and/or lateral shear of the wind with stronger flow to the left
of the direction of flow.
- Positive (or negative in the Southern Hemisphere) vorticity at
500 millibars is associated with cyclones or storms at upper levels,
and will tend to coincide with troughs in the geopotential height
field.
- Negative (positive in SH) vorticity is associated with calm weather,
and will tend to coincide with ridges in the geopotential height
field.